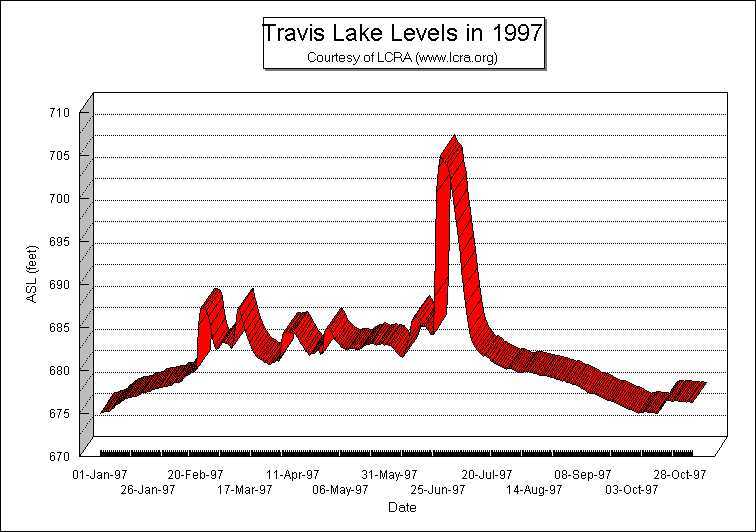
The following graph is produced in MS Excel using a humongous
datafile sent to me by the good folks at LCRA (Lower Colorado River Authority).
The left axis is in feet above sea level. The spillway of the dam is at
about 715 asl. See if you can spot the 11- and 22-year sunspot cycles.
(HINT: start at the low points/drought years) The first graph covers
up through a little after January 96.